
The Tiger Sighting Index provided for each national park is based on sightings data shared by local guides and naturalists. While every effort has been made to present an accurate reflection of recent tiger activity, this information is inherently anecdotal and may be subject to variation, human error, or bias. Wildlife sightings can never be guaranteed, as they depend on numerous unpredictable factors. We recommend using this index as a general guide rather than a definitive measure of sighting probability.
The Tiger Sighting Index is a percentage-based indicator derived from regular safari session data across each national park. Each day generally includes two standard safari sessions—morning and afternoon—resulting in approximately 60 sessions per month. If a tiger is sighted by any guide in any vehicle during a session, that session is marked as a successful sighting. For example, if tigers are sighted on 20 out of 60 sessions in a month, the index would be calculated as 20/60 = 33.33%.
Please note: Data from special permit safaris such as full-day and half-day sessions are excluded to ensure consistency across parks.
Tiger reserves in India are partially or fully closed during the monsoon season (typically from July 1 to September 30,), depending on local regulations. During this period, safari frequency and sighting reports may be limited or inconsistent, which can affect the accuracy and reliability of the index.
Click on any park name to explore a comprehensive breakdown of tiger sightings, including zone-wise patterns, time-of-day trends, and other insights drawn from reported data.
Multiple species across multiple timelines
Multiple species for last 12 months
Selected species for across all gates/zones
.webp)
Selected species versus Multiple Parks
Selected species across gates/zones, last 12 Months
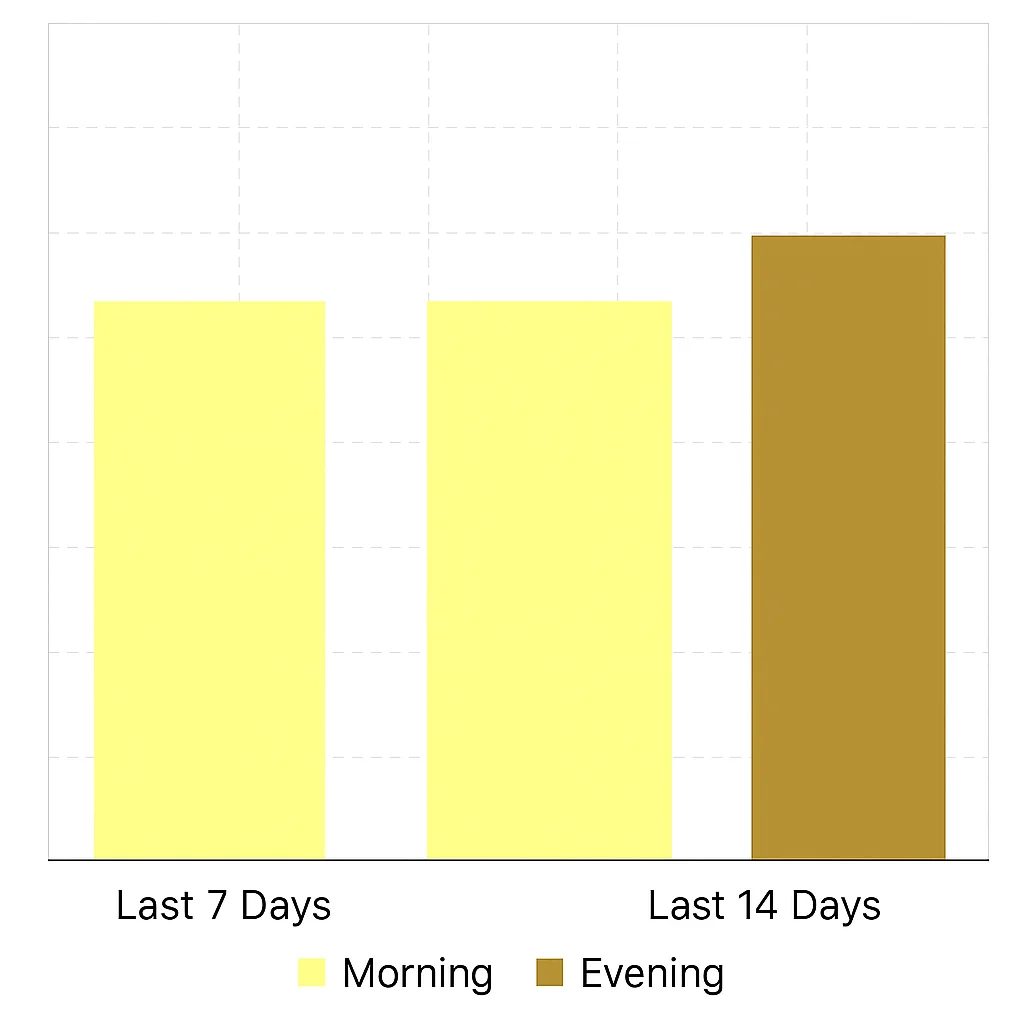
Multiple Species - Morning vs Evening
Tiger Sightings for last 7 days
Last week’s Tiger Sightings names & summary The Tiger Sighting Index is a percentage-based indicator derived from regular safari session data across each national park. Each day generally includes two standard safari sessions—morning and afternoon—resulting in approximately 60 sessions per month. If a tiger is sighted by any guide in any vehicle during a session, that session is marked as a successful sighting. For example, if tigers are sighted on 20 out of 60 sessions in a month, the index would be calculated as 20/60 = 33.33%.
Please note: Data from special permit safaris such as full-day and half-day sessions are excluded to ensure consistency across parks.
Tiger reserves in India are partially or fully closed during the monsoon season (typically from July 1 to September 30,), depending on local regulations. During this period, safari frequency and sighting reports may be limited or inconsistent, which can affect the accuracy and reliability of the index.
Click on any park name to explore a comprehensive breakdown of tiger sightings, including zone-wise patterns, time-of-day trends, and other insights drawn from reported data.
In calculating the Tiger Sighting Index, we consider a session as a “sighting” if at least one jeep reports a tiger during that safari session. This method is widely used across wildlife tourism to provide a standardized and comparable estimate of sighting frequency.
Tigers are solitary and elusive animals. In any given safari session, multiple jeeps may be assigned to different zones or routes within the park. As a result, it's common for only a few vehicles—or even just one—to spot a tiger while others may not. This doesn’t reduce the validity of the sighting; instead, it reflects the natural unpredictability of wildlife tracking. Our goal is to capture the presence and activity of tigers across sessions, not to guarantee equal sightings for every visitor. By using this method, we provide a conservative and consistent measure of tiger movement and visibility trends over time.
For the purposes of the Tiger Sighting Index, we count only one sighting per safari session, regardless of how many individual tigers were seen or how many jeeps reported them. Whether one tiger is sighted or ten, the session is still marked as a single sighting event.
This approach ensures:
Our goal is to track how often tigers are seen, not how many tigers are seen, since individual identifications and overlaps can often be unclear or unverified.
Our Tiger Sighting Index uses a cautious, session-based approach to reflect true activity—not hype. We count a session as a sighting if at least one confirmed tiger is reported, regardless of how many jeeps saw it or how many tigers appeared. This keeps the index fair, comparable, and grounded in the realities of how wildlife safaris operate.
The Tiger Sighting Index isn’t about maximizing numbers—it’s about giving a standardized, comparable measure of tiger activity across parks and time. It's a tracker of frequency, not volume
Wildlife data is inherently unpredictable.
Vehicles go to different zones, different tracks, and tiger movements vary widely.Counting one confirmed sighting per session ensures that the index reflects tiger presence, not crowd-driven exaggeration. To draw a comparison, "Just like rainfall is measured by the day it rains, not by the number of raindrops, we measure tiger activity by the session it’s sighted, not by how many tigers or jeeps were involved."
“By sticking to one sighting per session, we stay cautious and credible. The goal isn’t to hype—it's to inform.”
“This methodology is shared openly so that travelers, conservationists, and park enthusiasts can understand the index—and even suggest ways to refine it over time. We welcome healthy discussion because our goal is aligned: more honest, insightful wildlife experiences.”
Absolutely. This methodology is shared openly so that travelers, conservationists, and park enthusiasts can understand the index—and even suggest ways to refine it over time. We welcome healthy discussion because our goal is aligned: more honest, insightful wildlife experiences.
Yes. Many wildlife researchers and ecotourism platforms use similar frequency-based methods to track animal presence. The Tiger Sighting Index aligns with these global practices by measuring how often tigers are seen, not how many are seen.
Yes. It closely resembles the Encounter Rate, which is used in wildlife monitoring across Africa and India. If a species is observed even once during a safari or patrol, the entire session is considered a sighting. This is standard in scientific studies of elusive animals.
Platforms like eBird use a frequency index—species are marked as “seen” if they appear in a checklist for that session. It doesn’t count how many birds were seen, only that they were observed at least once.
India’s official Tiger Estimation Reports from WII and the National Tiger Conservation Authority use a combination of camera trap data, pugmarks, and field sightings from local guides and forest staff to estimate presence. Session-based sightings like ours are common in field data.
This approach avoids inflating numbers and ensures comparability. It reflects tiger presence, not crowd excitement. This conservative method also prevents a few high-activity sessions from skewing the index.
Not at all. Safari jeeps are distributed across different zones & tracks. A tiger in Zone/Tarck A may be completely invisible to vehicles in Zone/Track B. If any vehicle sees a tiger, it confirms tiger activity during that session—making the sighting valid.
Yes. Many popular indexes simplify complex data into easy-to-understand measures:
No. In fact, it's intentionally conservative. It counts only one sighting per session—regardless of how many tigers were seen or how many vehicles witnessed it. This helps maintain fairness across parks and time periods.
Yes. Researchers and ecotourism operators around the world use session-based methods to track sightings of whales, dolphins, and other marine animals. These methods typically record whether at least one individual of a species was seen during a single trip or observation session, providing valuable data on species presence, distribution, and trends over time.
Whale watching tours often report a sighting success rate—the percentage of trips where at least one whale was seen. For example, if whales are sighted on 15 out of 30 trips in a month, the sighting rate is 50%. This does not count how many whales were seen, just whether they were seen.
Yes. Marine biologists use something called the cetacean sighting frequency, which tracks the percentage of observation periods or scan sessions where dolphins, whales, or porpoises are seen. Like our index, this method focuses on presence rather than quantity.
An encounter rate is the number of animal sightings per unit effort—such as per nautical mile traveled or per hour of observation. This rate helps researchers understand animal distribution and activity patterns over time.
Yes. Platforms like Oceans collect marine animal sightings from divers, snorkelers, and boaters around the world. These are recorded as "yes/no" sightings per trip, and used to calculate sighting frequencies—just like our Tiger Sighting Index does for safari sessions.
They show that our method is part of a globally recognized and scientifically accepted practice for tracking wildlife. Whether on land or at sea, using session-based presence data is a valid, consistent way to reflect animal activity and help inform both conservation and tourism.
At WildTrails, we are passionate travelers dedicated to making your journeys seamless, exciting, and unforgettable. Whether you’re seeking breathtaking landscapes, cultural experiences, or hidden gems, we provide the inspiration and tools to help you explore the world with ease.


